
Monthly Investment Newsletter - February 2026
High-Yield Window Narrowing
Compression Returns as Supply Lags Demand
The senior housing sector is currently experiencing a rare alignment: occupancy momentum, limited new supply, and improving capital markets – all while demographics continue to build in the background.
Cap Rate Compression Is Returning
Early 2026 has shown signs of cap rate compression returning, and this has dramatic implications for investors.
The “High-Yield Window” of Pricing and Sourcing is Narrowing
With a thin development pipeline, improving operating performance, and capital returning to the sector, high-quality assets tend to re-price first, driving yield compression.
What’s tightening:
- Pricing clarity is improving as cap rates begin to compress and more buyers re-enter the market.
- Best-in-class assets and operators tend to re-price first, shrinking the pool of truly attractive opportunities.
- New supply is not arriving fast enough to relieve capital markets, which supports occupancy and rent resilience.
The pricing dislocation that existed when capital markets were strained, and when uncertainty was elevated is tightening. This was a period when buyers could underwrite wider yields simply because financing was expensive, transaction volume was choppy, and sellers were still recalibrating expectations.
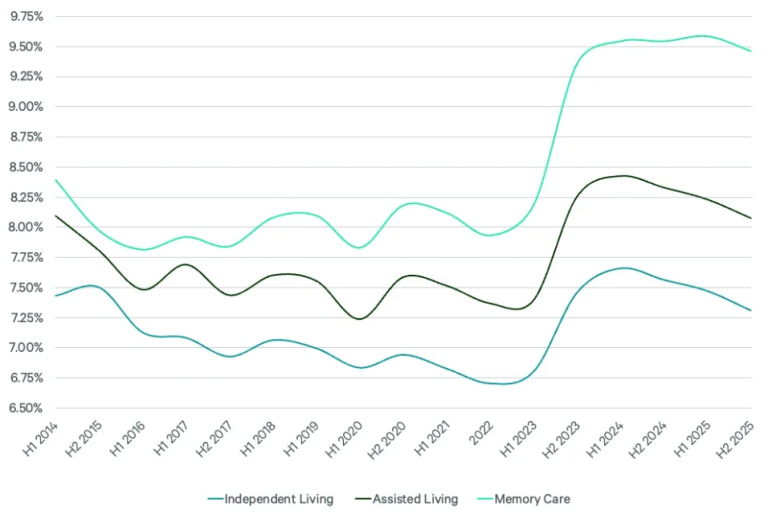
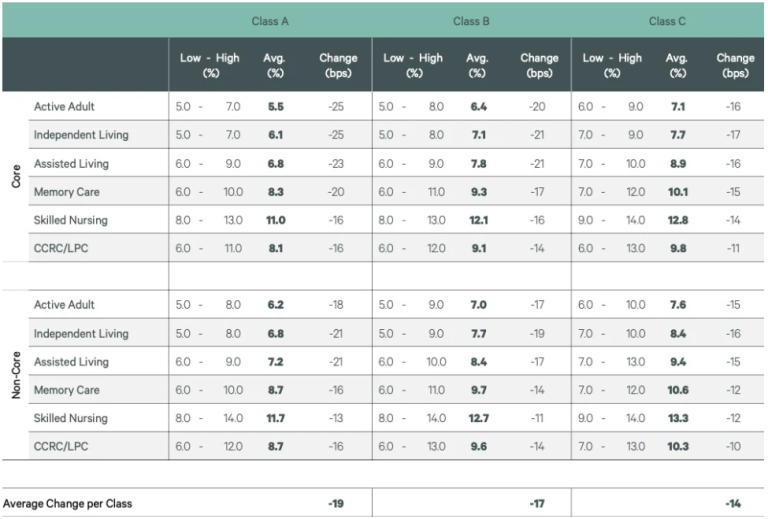
Recent survey data reflects this shift. As shown below, cap rates across nearly every senior housing segment declined in the most recent reporting period — with average compression of ~19 basis points for Class A assets, ~17 bps for Class B, and ~14 bps for Class C.
The market is no longer pricing senior housing strictly through the lens of capital market stress. It is increasingly pricing through the lens of operating performance and long-term supply constraints.
Today, as fundamentals stabilize and confidence returns, those “wide-yield” entry points are becoming harder to find.
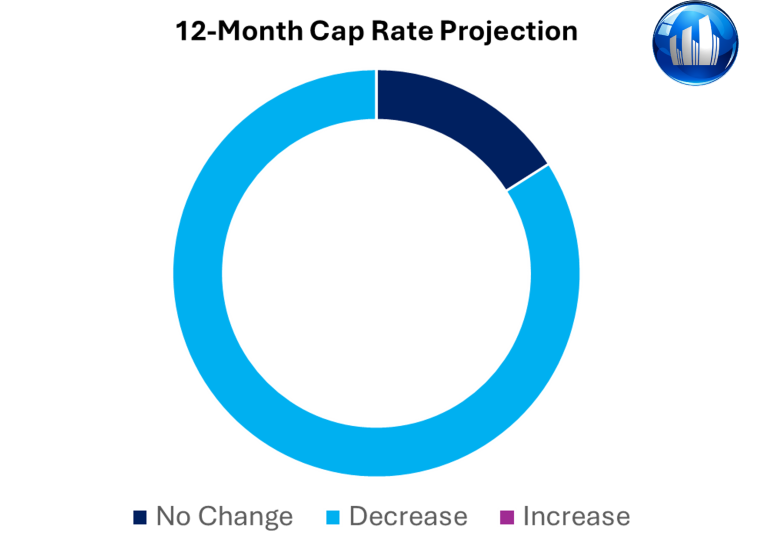
The market has been reflecting this shift: valuations improved in 2025 alongside measurable cap-rate compression. Looking forward, a large share of industry participants anticipate further cap rate compression through 2026. Within CBRE’s H2 2025 U.S. Senior Housing & Care Investor Survey, 84% of respondents expect cap rates to compress over the next 12 months, with 0% expecting cap rates to increase in 2026.
The practical implication is that the “discounted entry” phase becomes harder to find — not because the demand story is weakening, but because fundamentals and financing conditions are making senior housing more investable again.
Development Falling Behind – Current Supply Occupied
Industry fundamentals are strengthening at the same time supply remains structurally limited.
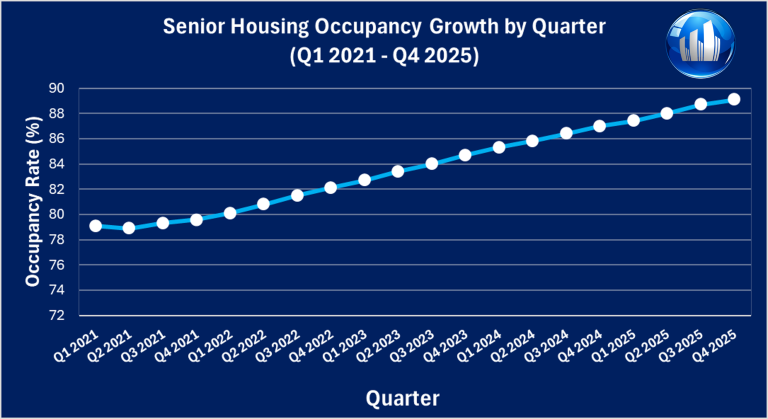
Senior housing is currently experiencing record high occupancy, while also experiencing record-low supply growth. Net unit absorption for the industry outpaced new supply 4.8 to 1 in 2025. Q4 2025 marked 4.5 years of consistent occupancy growth, reaching ~90% (the highest level recorded since 2017).
Meanwhile, units under construction fell to 2.3% of inventory (the lowest level since 2012). Year-over-year inventory growth fell to ~1% in 2025, the lowest since 2006.
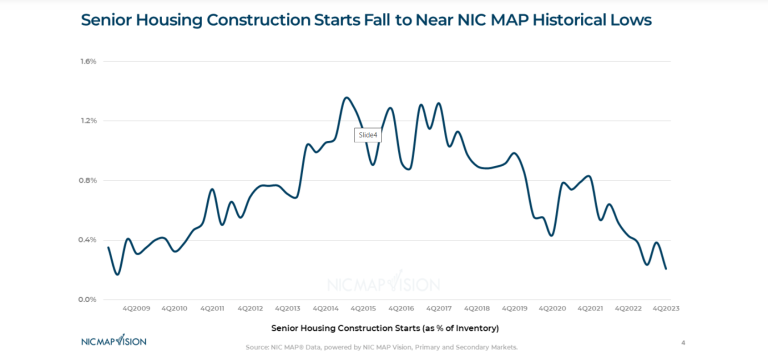
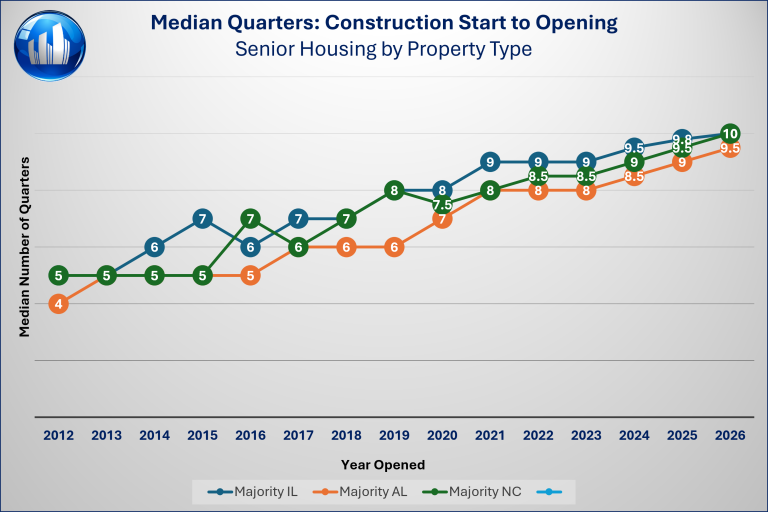
Importantly, even once development begins to accelerate, supply does not pick up “quickly”. Average construction cycles have stretched to ~29 months, meaning projects breaking ground in early 2026 are unlikely to open before 2028.
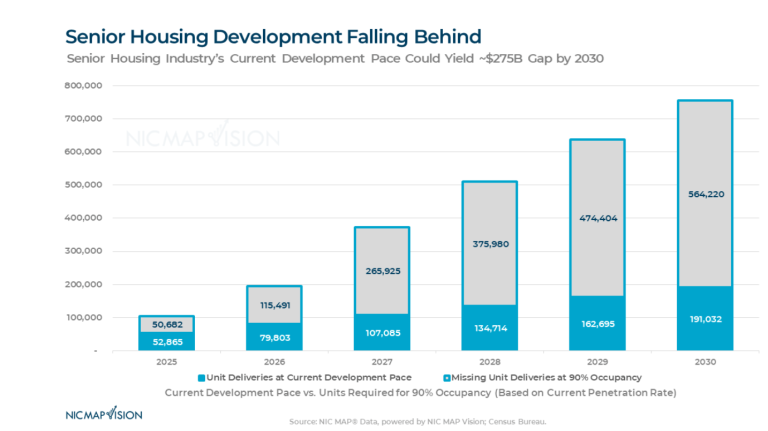
The sector is projected to need 200,000+ units by 2028, while only 20,034 units were under construction as of Q3 2025. Based on NIC MAP Vision data, the current pace of development could leave an estimated $275 billion gap by 2030, reflecting the difference between units delivered and units required to sustain 90% occupancy levels.
This helps explain why investors are willing to pay for stabilized communities, because new supply is not arriving fast enough to reset the market.
Operational Excellence in Action: Decatur, IL
While industry fundamentals continue to improve, performance ultimately comes down to execution at the community level.
We’re proud to share that our investment community, The Carriages of Decatur, has been recognized as a “Best of 2026” community by A Place for Mom, one of the nation’s leading senior housing referral platforms.
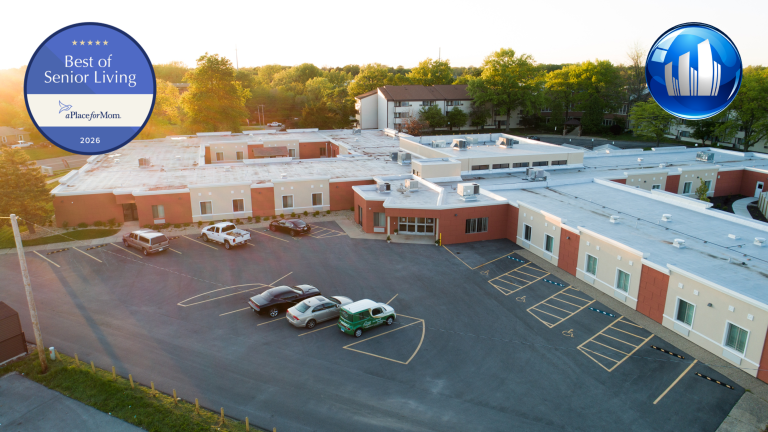
Best of Senior Living award winners represent the top 1-2% of senior care providers nationwide based on reviews from those who matter most: residents and families. Recognition like this reflects:
- Resident satisfaction
- Staff quality and consistency
- Strong operational leadership
- A community environment families trust
In a tightening capital markets environment, high-quality operators and communities are increasingly differentiated — and that differentiation supports both resident outcomes and long-term value creation.
Want To Participate?
If you’d like to learn more about SLF Investments and our approach to investing in high-quality senior housing communities, contact us today!
The Senior Living Fund investment team is comprised of industry, securities, financial, and investment experts, as well as support personnel, based primarily in the Kansas City metropolitan area.